Today, we will talk about the process of monitoring applications orchestrated by .NET Aspire. But before we do it, let’s remind ourselves why monitoring is something we absolutely must have in our applications.
Monitoring applications is crucial for several reasons:
- Early detection of issues: Monitoring allows us to detect issues such as errors, failures, performance bottlenecks, or security breaches early on. Early detection enables proactive responses, minimizing the impact on users and the business.
- Improved reliability and availability: Monitoring helps ensure that our applications are reliable and available. By tracking uptime, response times, and error rates, we can identify areas for improvement and implement measures to enhance reliability and availability.
- Optimized performance: Monitoring provides insights into the performance of our applications and infrastructure. By analyzing metrics such as CPU utilization, memory usage, and response times, we can identify performance bottlenecks, optimize resource allocation, and improve overall system performance.
- Capacity planning and scalability: Monitoring helps us understand resource utilization patterns and trends over time. With this information, we can perform capacity planning and make informed decisions about scaling our infrastructure to meet current and future demands.
- Cost optimization: Monitoring enables us to optimize costs by identifying inefficiencies and areas of resource waste. By analyzing metrics related to resource utilization and performance, we can right-size our infrastructure, eliminate unnecessary expenses, and maximize cost-effectiveness.
- Enhanced security: Monitoring helps detect and mitigate security threats and vulnerabilities in our applications and infrastructure. By monitoring access logs, audit trails, and security events, we can identify suspicious activities, enforce security policies, and protect sensitive data from unauthorized access.
- Compliance and regulatory requirements: Many industries have regulatory requirements and compliance standards that mandate monitoring and reporting of certain metrics and events. Monitoring helps ensure compliance with these requirements and facilitates auditing and reporting processes.
- Customer satisfaction: Monitoring applications and maintaining high levels of reliability and performance contribute to a positive user experience. By proactively addressing issues and minimizing downtime, we can enhance customer satisfaction and loyalty.
Let’s now look at the different types of monitoring available to us.
Components of monitoring systems
Logging, metrics, and traces are essential components of monitoring systems in distributed environments like microservices architectures. Each serves a distinct purpose in providing visibility into the behavior and performance of applications. Here’s how they are used for monitoring:
- Logging:
- Purpose: Logging involves capturing and storing records of events that occur within an application or system. These events can include informational messages, errors, warnings, and debugging information.
- Usage: Logging is used to track the execution flow of applications, record errors, and exceptions, and provide diagnostic information for troubleshooting issues. Logs can contain timestamps, severity levels, contextual data, and other relevant details.
- Examples: Log entries might include HTTP request/response details, database queries, service interactions, and application-specific events. Logs are typically written to files, databases, or centralized logging platforms like ELK (Elasticsearch, Logstash, Kibana) or Splunk.
- Metrics:
- Purpose: Metrics are quantitative measurements that provide insight into the performance, resource utilization, and behavior of applications and systems over time. Metrics are typically numerical values that are collected at regular intervals.
- Usage: Metrics are used to monitor the health, performance, and efficiency of applications. They help identify trends, anomalies, and performance bottlenecks, and they enable capacity planning and resource optimization.
- Examples: Common metrics include CPU utilization, memory usage, response times, throughput, error rates, and request latency. Metrics are often collected and aggregated using monitoring systems like Prometheus, Graphite, or Datadog.
- Traces:
- Purpose: Traces provide end-to-end visibility into the flow of requests as they traverse through a distributed system composed of multiple microservices. A trace represents a single request’s journey and captures information about each service it interacts with.
- Usage: Traces are used to diagnose latency issues, identify service dependencies, and understand the overall performance of distributed systems. They enable developers and operators to pinpoint bottlenecks, analyze request flows, and optimize system performance.
- Examples: Traces consist of spans, which represent individual operations within a request. Spans capture timing information, contextual data, and metadata related to each operation. Distributed tracing systems like Jaeger, Zipkin, or OpenTelemetry are used to collect, visualize, and analyze traces.
Let’s now look at how all of these types of monitoring are utilized in .NET Aspire.
Monitoring Aspire applications
To learn the fundamentals of how monitoring is done inside an Aspire application, it’s sufficient to have a look at the Aspire starter project. An example of a basic project created from this template can be found here.
By default, Aspire relies on OpenTelemetry for monitoring. OpenTelemetry is a standardized open-source technology for collecting metrics, traces, and logs. More details are available on its official website.
Before we can get started, we will need to install the relevant dependencies for monitoring. The Service Defaults project, which is represented by the AspireApp.ServiceDefaults class library in the example referenced above, has the following dependencies. All of these come as a standard:
OpenTelemetry.Exporter.OpenTelemetryProtocol: This package contains the open telemetry protocol exporter (OTLP exporter). It serves as a standardized way for OpenTelemetry components (like SDKs and collectors) to communicate with each other and with backend observability platforms.OpenTelemetry.Extensions.Hosting: This package provides an automated way of starting and stopping the tracing mechanism of OpenTelemetry.OpenTelemetry.Instrumentation.AspNetCore: This package enables the integration of OpenTelemetry components with the ASP.NET Core middleware.OpenTelemetry.Instrumentation.Http: This package allows the users to collect telemetry and export it to their backend of choice via HTTP.OpenTelemetry.Instrumentation.Runtime: This package automatically collects metrics associated with the .NET runtime, such as garbage collection, memory usage, thread pools, etc.
The names of all these packages begin with OpenTelemetry. This is because they are related to the OpenTelemetry framework. This framework is an open-source project that aims to provide a set of standardized, vendor-agnostic tools and APIs for collecting, processing, and exporting telemetry data (metrics, logs, and traces) from distributed systems and microservices architectures.
Because it is a vendor-agnostic and standardized framework, the Aspire project template uses it as a primary choice for enabling monitoring tools in the application. However, we can choose to use the alternatives instead, of which there are many.
Now, once we added appropriate packages to enable logging, metrics, and tracing, we can configure them inside the orchestrated applications.
Configuring the telemetry
If we open the Extension.cs file in the AspireApp.ServiceDefaults project, we will be able to find the following invocation:
builder.ConfigureOpenTelemetry();
This is an invocation of the method that registers all dependencies related to the telemetry. The method itself also exists in our code. Let’s examine it step-by-step.
It begins with the following code:
builder.Logging.AddOpenTelemetry(logging =>
{
    logging.IncludeFormattedMessage = true;
    logging.IncludeScopes = true;
});
This is how we register OpenTelemetry logging. This will allow us to collect the logs in such a format that we will be able to send the logs to a common OpenTelemetry endpoint.
Next, we have the following block of code:
builder.Services.AddOpenTelemetry()
    .WithMetrics(metrics =>
    {
        metrics.AddAspNetCoreInstrumentation()
            .AddHttpClientInstrumentation()
            .AddRuntimeInstrumentation();
    })
This is how we enable OpenTelemetry metrics to be collected.
After this, we are chain-invoking the following methods to allow the traces to be collected:
.WithTracing(tracing =>
    {
        if (builder.Environment.IsDevelopment())
        {
            // We want to view all traces in development
            tracing.SetSampler(new AlwaysOnSampler());
        }

        tracing.AddAspNetCoreInstrumentation()
            // Uncomment the following line to enable gRPC instrumentation (requires the OpenTelemetry.Instrumentation.GrpcNetClient package)
            //.AddGrpcClientInstrumentation()
            .AddHttpClientInstrumentation();
    });
We complete this method by performing the following invocation:
builder.AddOpenTelemetryExporters();
This method configures the mechanism for sending telemetry to a specific endpoint. If we search our code for the implementation of AddOpenTelemetryExporters(), we will see that it starts with the following:
var useOtlpExporter = !string.IsNullOrWhiteSpace(builder.Configuration["OTEL_EXPORTER_OTLP_ENDPOINT"]);
Essentially, we will only export the telemetry to the specified OpenTelemetry endpoint if the address of the endpoint is set in the OTEL_EXPORTER_OTLP_ENDPOINT setting. However, despite not having this setting anywhere, this expression will still pull its value and we will have the OpenTelemetry endpoint to send the telemetry to. This is because, in the development environment, the value of this setting is set to http://localhost:4318 by default.
Finally, we are configuring the telemetry exporters to export all three types of measurements:
if (useOtlpExporter)
{
    builder.Services.Configure<OpenTelemetryLoggerOptions>(logging => logging.AddOtlpExporter());
    builder.Services.ConfigureOpenTelemetryMeterProvider(metrics => metrics.AddOtlpExporter());
    builder.Services.ConfigureOpenTelemetryTracerProvider(tracing => tracing.AddOtlpExporter());
}
We are now familiar with how to configure our application to collect the telemetry. Let’s now look at how we can view the telemetry that has been collected.
Viewing information on the dashboard
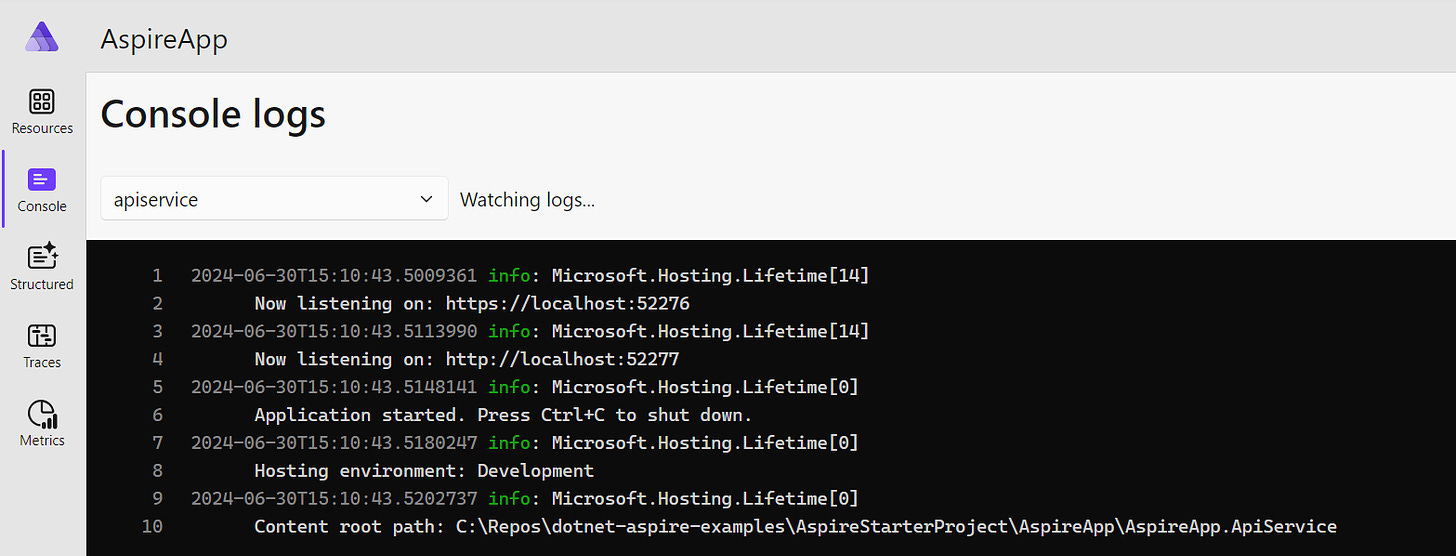
We can see all the measurements in the Aspire dashboard once we launch the app. For example, we can open the Console tab to view the console logs for any of our services, as the following screenshot demonstrates:

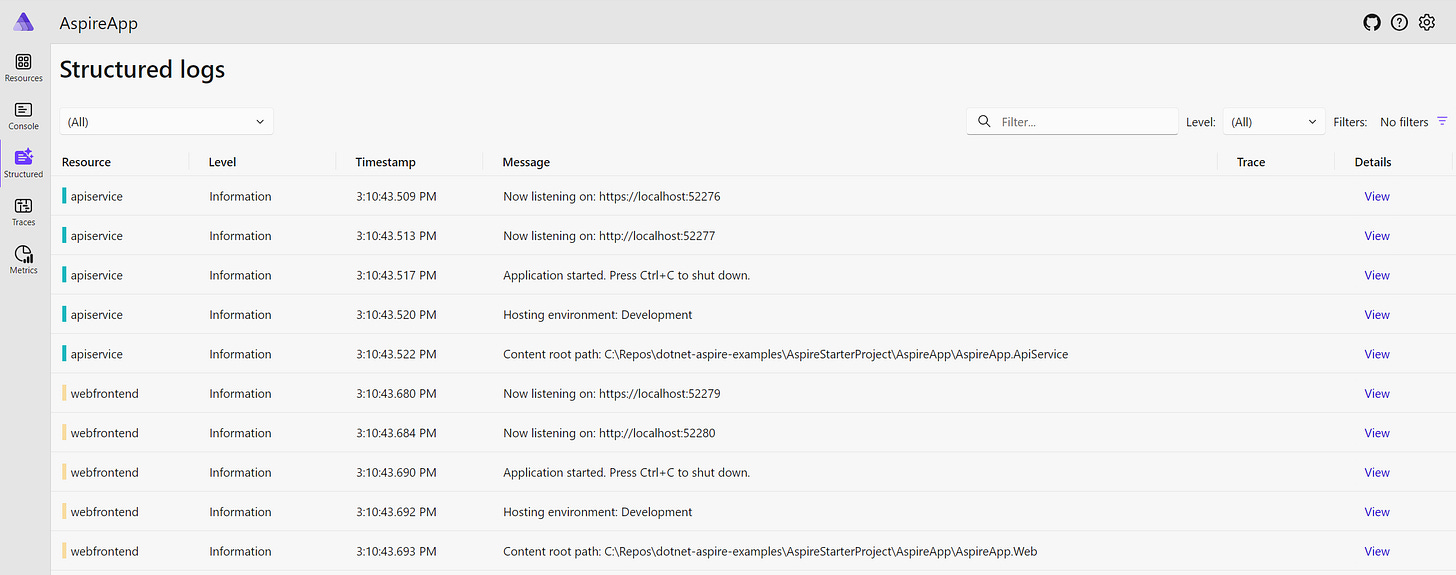
We can also open the Structured tab to view the structured logs for all services:

The Traces tab will have information similar to the following:

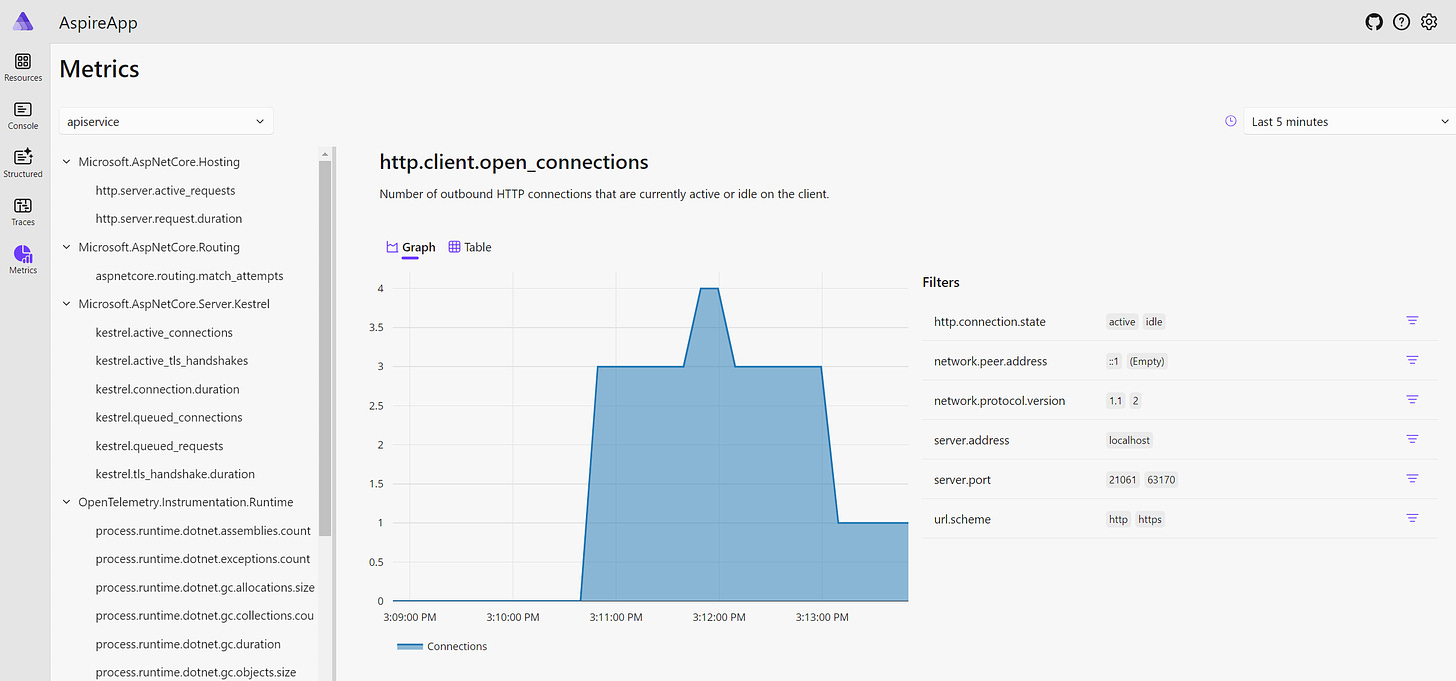
If we open the Metrics tab, we will have a very wide range of different metrics to view:

This is how we can use .NET Aspire to monitor all applications in a single place.
Wrapping Up
As we saw today, .NET Aspire makes it easy to monitor the orchestrated application with its multi-functional dashboard. By default, it uses OpenTelemetry, which is a standardized and platform-agnostic way of collecting the telemetry.
However, logging, traces, and metrics are not the only tools we need to monitor our applications. These tools allow us to see what happened in the application in the past, but we also need a mechanism for determining whether or not each of our applications is working correctly right now. This is what we will cover next week, so stay tuned!
P.S. If you want me to help you improve your software development skills, you can check out my courses and my books. You can also book me for one-on-one mentorship.


